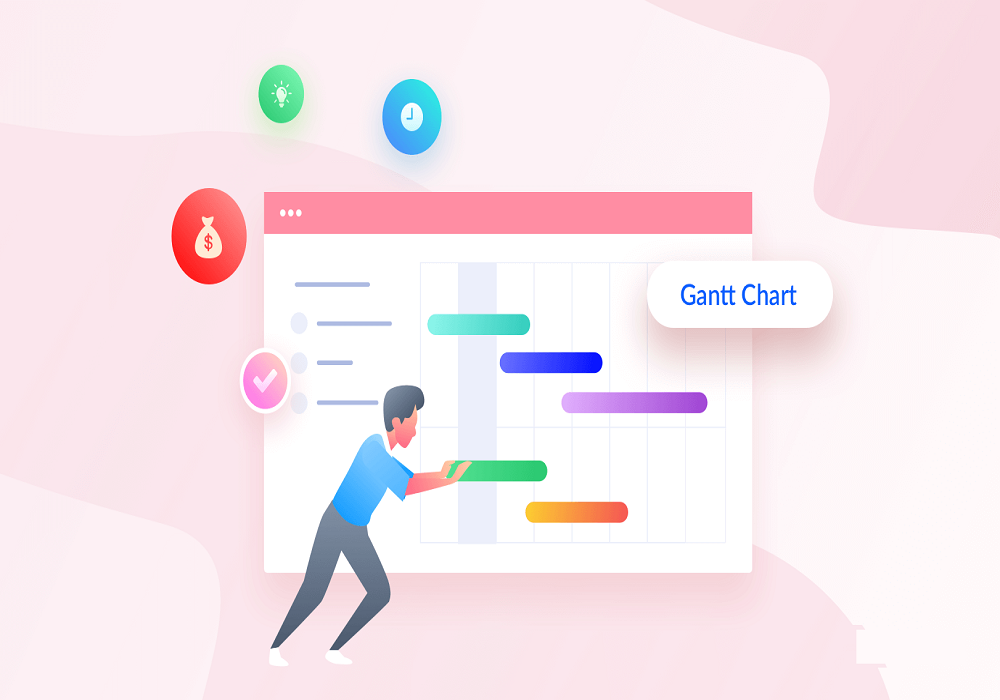
A Gantt chart is a horizontal bar chart that shows a project’s planned schedule and its tasks or events over time. Each bar in the Gantt chart represents a task, while the dates are laid out horizontally. In this post, we’ll take a closer look at What is Gantt charts.
Gantt charts are commonly used as project schedules because they are one of the most useful and classic ways of showing activities displayed against time. They can also show task dependencies — how each task connects to others. In the realm of project management, where timelines and task dependencies dictate success, the Gantt chart stands tall as a visual beacon, guiding project managers through the complexities of planning and execution. In this comprehensive exploration, we will dissect the anatomy of Gantt charts, uncover their historical roots, delve into their practical applications, and discuss how they have become indispensable tools in achieving project success.
I. Evolution and Origins of Gantt Charts:
- Henry L. Gantt’s Pioneering Vision:
- Tracing the roots of Gantt charts to the early 20th century, attributed to industrial engineer Henry L. Gantt.
- Initially used in manufacturing and construction for scheduling and visualizing task dependencies.
- Purpose and Significance:
- Core purpose: Provide a visual representation of project timelines and task dependencies.
- Significance: Streamlining communication, enhancing planning precision, and fostering efficient resource allocation.
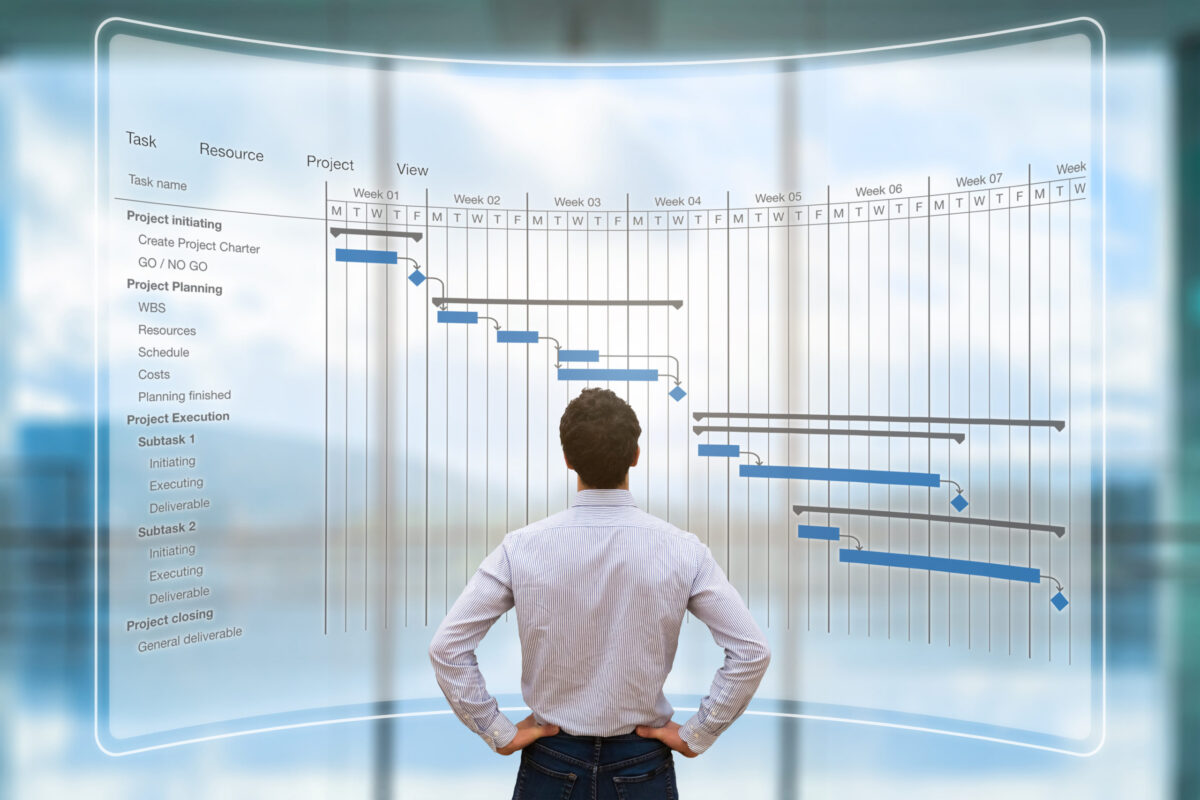 II. Key Components of a Gantt Chart: II. Key Components of a Gantt Chart:
- Task Bars and Time Axis:
- Task Bars: Graphic representations of individual tasks or activities, with length proportional to task duration.
- Time Axis: Horizontal timeline depicting project duration, segmented into days, weeks, or months.
- Milestones and Progress:
- Milestones: Distinct markers indicating significant achievements or deadlines, often represented by diamonds.
- Progress Tracking: Visual cues, such as shading or highlighting, to denote completed tasks and overall project progress.
III. Constructing a Gantt Chart:
- Task Identification and Sequencing:
- Task List Compilation: Creating a comprehensive list of all tasks involved in the project.
- Sequencing Tasks: Organizing tasks chronologically based on dependencies and priorities.
- Duration Estimation:
- Time Estimates: Assigning realistic durations to each task, drawing on historical data and expert judgment.
- Buffer Time: Incorporating buffer time to accommodate unforeseen delays and challenges.
IV. The Role of Gantt Chart Software:
- Project Management Tools:
- Microsoft Project: Widely-used software providing robust Gantt chart features.
- Cloud-Based Solutions: Smartsheet, Asana, and Trello as versatile, collaborative tools with Gantt chart functionalities.
- Benefits of Gantt Chart Software:
- Collaboration: Centralized platforms fostering team collaboration in task management.
- Real-Time Updates: Providing real-time visibility into project progress for the entire team.
V. Gantt Charts in Action:
- Project Planning and Scheduling:
- Task Assignment: Clearly assigning tasks, delineating responsibilities and deadlines.
- Resource Allocation: Optimizing resource allocation through visualization of task dependencies and constraints.
- Communication and Stakeholder Engagement:
- Stakeholder Communication: Gantt charts as powerful communication tools, conveying complex timelines transparently.
- Client Presentations: Enhancing client understanding through visual representations of project timelines and milestones.
VI. Challenges and Limitations:
- Complexity and Scale:
- Project Size Impact: Gantt charts may become unwieldy for large projects, requiring careful consideration of detail levels.
- Dynamic Environments: Challenges in adapting Gantt charts to rapidly changing project requirements.
- Maintenance and Updates:
- Manual Updates: Regular manual updates are necessary for accuracy, which can be time-consuming.
- Software Dependencies: Over-reliance on software tools may pose challenges with compatibility and updates.
VII. Best Practices for Gantt Chart Usage:
- Regular Updates and Monitoring:
- Dynamic Adjustments: Regularly updating Gantt charts to reflect changes in task durations, dependencies, and resource availability.
- Real-Time Monitoring: Leveraging project management tools for real-time progress tracking and issue identification.
- Clear Communication:
- Stakeholder Engagement: Utilizing Gantt charts as communication tools to engage stakeholders and ensure shared understanding.
- Visualization Techniques: Employing color-coding and annotations to highlight critical paths, milestones, and potential risks.
Choosing the best project management software for your team
Good project management software will help you collaborate effectively and ensure that your projects are successful. If you’re looking for a simple and intuitive project management tool, take Kissflow Project for a spin. It comes with everything you’ll need to effectively pull off projects. You can start using it for free.
Conclusion:
As a time-tested ally in the project manager’s toolkit, Gantt charts continue to evolve, adapting to the demands of modern project management. Understanding their historical roots, components, and best practices empowers project managers to navigate the intricacies of project timelines with precision and clarity. The Gantt chart’s visual prowess, coupled with contemporary project management software, remains a steadfast guide in steering projects toward successful completion.
Is this article What is Gantt Charts – Features and Benefits Explained helpful? |